

Franchise demographic research means profiling the people who buy from a franchise, then measuring how many of them live, work or travel through the territory you are considering. Do it before you sign, and you replace a hunch about a location with evidence. The method is simple: describe the customer, find the same people on a map, set a realistic catchment, then test the result against competition and your own finances. If you are a buyer, it tells you whether a territory can support the business. If you are a franchisor, it tells you where to place the next unit and how to draw boundaries that do not set franchisees against each other.
Your search for the right model can start with Franchise Local’s directory, where you can filter UK franchises by industry, budget, lifestyle and location. Then use the steps below to test the territory behind any shortlisted brand.
What demographic research means for a franchise
Demographics are the measurable traits of a population: age, household make-up, income, employment, qualifications, housing and population density. Demographic research takes those traits and links them to a franchise’s customer. A children’s activity franchise needs households with young children. A home care franchise needs older residents and the families who arrange care for them. A business-to-business franchise needs a healthy mix of local employers.
The aim is to answer three practical questions:
- Who buys? The age, income and lifestyle of the typical customer.
- How many are there? The number of matching people or households within reach of the territory.
- Is that enough? Whether the number, after allowing for competition and realistic take-up, supports a viable business.
Psychographics sit alongside demographics. These are the wants, habits and motivations behind a purchase. Two postcodes can have the same average age and income and still behave differently, so use the numbers to narrow the field and local knowledge to make the final call.
Who needs it: buyers and franchisors
The two sides use the same data for different decisions.
Buyers and investors use it to test a territory they have been offered, or to compare two or three locations for the same brand. They are asking: will enough of the right customers be near me to reach the franchisor’s projected sales?
Existing business owners expanding by franchising, and franchisors, use it to decide where to recruit, how many territories the country can support and where each boundary should fall. Well-drawn territories give each franchisee a fair share of the market and a defensible claim on it.
Consultants and advisers use it to back a recommendation with a number a client can check.
If you are choosing a franchise rather than designing a network, start at step 1 below and apply every step to the territory you have been offered.
The research process, step by step
1. Profile your best customer first
The most common mistake is pulling area data before you know what you are looking for. Start with the customer. For an existing franchise, ask the franchisor for the profile of customers at its strongest units: age range, gender, household type, income or spending power, how they buy and why. Then write one paragraph describing the typical buyer in plain words.
The UK government’s business support service, business.gov.uk, sets out the same starting point for demand research: profile current customers, then compare them with potential buyers in the target market.
Where it goes wrong: describing the customer you hope for, not the one the brand actually serves. A premium service sold mainly to homeowners aged 45 to 65 should be researched on that group, not on the whole population.
2. Choose a handful of measurable traits
Turn the profile into three to six measures you can find in public data. For a consumer franchise they usually fall into three groups:
- Composition: how many households of the right type live in the area.
- Workforce: how many people are in the area during business hours, which matters for lunchtime food, convenience and services used near work.
- Trajectory: whether the population is growing, ageing or shrinking.
The Maptive guide to scoring territories uses this same three-way split for consumer concepts. Keep the list short. Ten weak measures hide the two that matter.
3. Pull the data for your territory
UK readers have strong free sources. The 2021 Census, published by the Office for National Statistics (ONS), covers age, household composition, employment, qualifications and housing tenure for England and Wales, down to small neighbourhood areas. Scotland and Northern Ireland publish their own census results through their statistical agencies. The ONS also publishes time series of age by local authority, so you can see whether an area is getting younger or older. Comparisons across census years need care because boundaries and methods change.
For business-facing franchises, the ONS publishes business demography data on business births, deaths and survival by area and industry. Its Nomis service gives detailed counts of local businesses by activity, size and location.
You can do this work in a spreadsheet. Download the figures for your territory’s postcodes or local authority, set them beside the national average, and mark where the area is above or below it on each of your chosen measures.
4. Set a realistic catchment, not just a circle
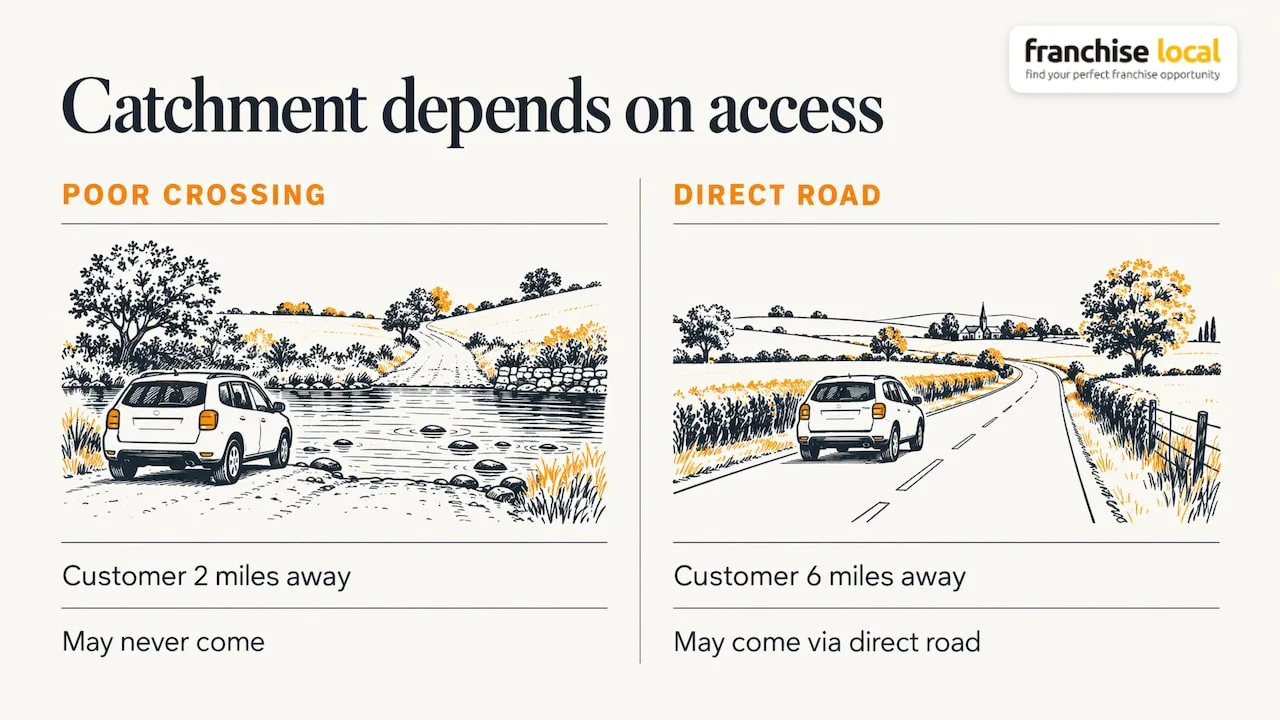
A catchment is the area from which customers will actually be drawn. Many people draw a radius of three or five miles and stop there. That is a start, but real catchments are shaped by road and rail links, rivers, motorways, town centres and habit. A customer 2 miles away across a poor crossing may never come, while one 6 miles away on a direct road may.
University research on UK shopping catchments makes the point that the reach of a location varies with the strength of the offer, competing locations, where people cluster and the barriers to getting there. For a service delivered to the customer’s home, the equivalent is drive time: how many homes you can serve in a working day without wasting hours in the van.
Use the same measure for every location you compare, whether that is a radius or a drive-time zone. Comparing a 20-minute zone in one town with a 5-mile circle in another tells you nothing.
5. Count the matching customers
Now combine steps 1 to 4. Count how many households or people in your catchment match the customer profile. Then apply a realistic take-up rate: the share of those people who might buy from you in a year. Use the franchisor’s figures from existing units if they have them, and keep your own assumptions cautious.
This is how franchisors estimate how many territories the market can support: profile the matching prospects in each area, apply conservative conversion assumptions, then divide into viable territories. If you are buying, the same arithmetic tells you whether the sales the franchisor projects need an unrealistic share of local people.
You can set the resulting revenue against costs with the Franchise ROI and Profitability Estimator, and read the four numbers that decide unit economics before treating any projection as safe.
6. Compare against your best existing units
A scoring model is only as good as its baseline. Build it from the profile of the top-performing units, for example the top quarter or so by revenue, and then score candidate areas against that profile. Doing it the other way round, collecting data on a market first and then asking whether it looks good, leads to false confidence. A buyer can ask the franchisor which kinds of area its best franchisees operate in, then see whether the offered territory looks like them.
7. Check competition and local conditions
Demographic counts show the size of the opportunity, not how much of it is already taken. Business.gov.uk advises adjusting any demand estimate for competition, your own resources, access to distribution and other factors that could affect sales.
The practical checks are:
- Direct competitors in your catchment, what they charge and how busy they appear.
- Transport and access: car parking, public transport, footfall patterns.
- Local business mix, if your customers are other businesses or workers.
- Regulated registers, where they exist. A nursery operator, for instance, can find comparable settings in a five-mile area through the Ofsted website and then visit them to learn fees and waiting lists.
Our franchise competitor analysis guide walks through how to do this as a buyer.
Which measures matter for which franchise
No single demographic decides every case. Match the measure to the business:
| Franchise type | Measures that usually matter most |
|---|---|
| Children’s education and activities | Households with children, income, school-age population growth |
| Home care and later-life services | Residents aged 65 and over, home ownership, household make-up |
| Fitness, health and beauty | Working-age adults, income, daytime and evening population |
| Food and convenience | Footfall, workforce numbers, commuter flows, student population |
| Home services and maintenance | Homeownership, property age and value, household income |
| Business-to-business services | Number and size of local employers, business survival and growth |
Use the table as a starting list, then confirm each measure against the franchisor’s own customer data.
A worked example
Suppose you are looking at a franchise that serves households with children aged 5 to 11, and the franchisor’s best units draw most customers from the middle and upper income bands. You are comparing two territories.
- Define the profile: families with children aged 5 to 11, above-median household income, living within a 20-minute drive.
- Pull the data: for each territory, take Census 2021 figures for household composition, age and employment for the neighbourhoods inside the 20-minute zone.
- Count and compare: Territory A has more matching households in total, but many of them are in the zone’s far corners with poor road links. Territory B has fewer, but they are concentrated close to the centre.
- Check competition: Territory A already has several established providers. Territory B has one.
- Decide: Territory B may offer a better reachable market even with a lower raw count. You then test it against the franchisor’s sales projections and your own costs.
The figures here are illustrative. The point is the order of work: profile, count, catchment, competition, then finances.
How franchisors use it to profile franchisees
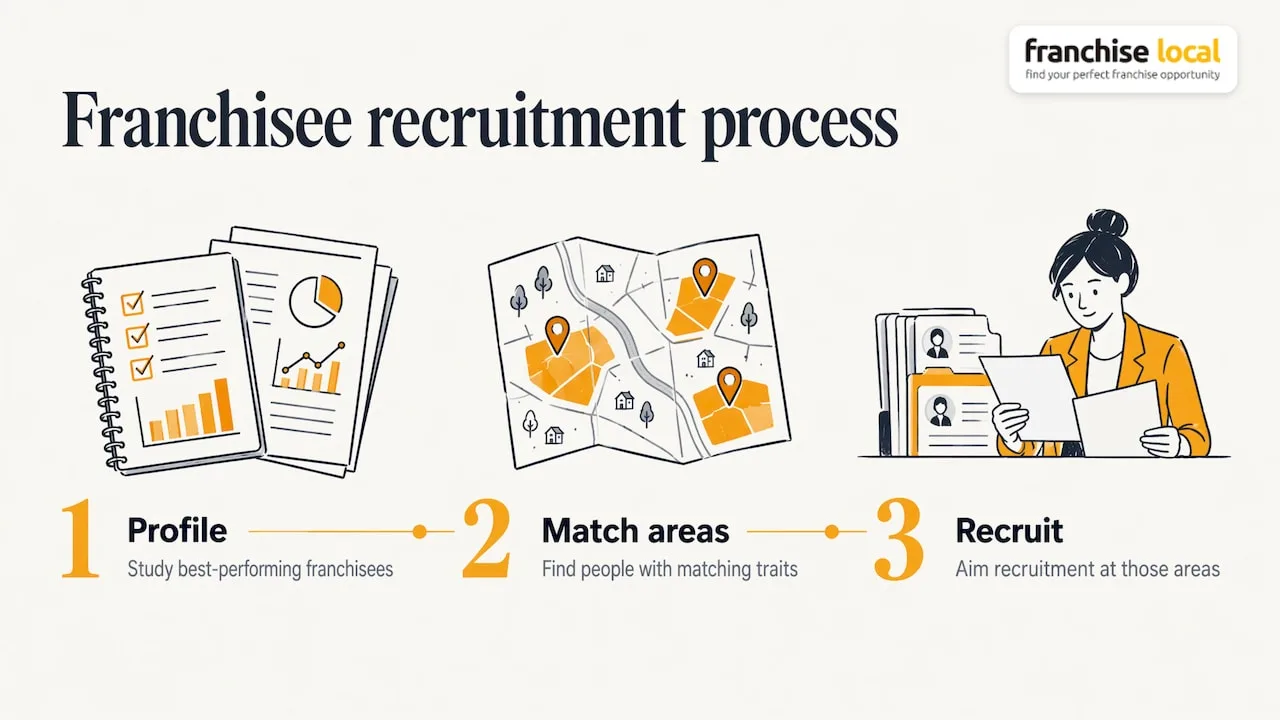
Demographic research is not only about customers. A franchisor can apply the same method to the people it wants to recruit. Look at the existing franchisees who have performed best and note the traits that count: previous sector, age range, whether they were running a business before, how close they live to their territory, and the household finances that let them fund the start-up. Then look for areas with plenty of people matching that profile, and aim recruitment there.
That gives a franchisor two maps: one of customers and one of likely franchisees. Where the two overlap, recruitment is easier and local knowledge is stronger. For advice on reaching those people, see our guide to franchise advertising and finding interested buyers.
Territory design matters just as much. Mapping demand before drawing boundaries helps avoid overlapping territories, which can leave franchisees competing for the same customers. Our guides on how to select franchise territories and how to map out more franchise territories cover the practical side.
Mistakes that skew the result
- Averages hiding the detail. A borough average can mask a wealthy ward beside a struggling one. Work at neighbourhood level where you can.
- Old data. Census 2021 is the most detailed picture of the population, but areas change. Check it against more recent local information, such as new housing developments or closures.
- Treating demographics as demand. Matching people live nearby, but that does not mean they will buy. Your take-up assumption carries the risk, so keep it modest.
- Ignoring supply. A neighbourhood with ideal customers and four established rivals may be worse than a quieter one with one.
- Researching in isolation. Compare any prospective location with existing strong and weak units, not just with the national average.
Where Franchise Local fits
Demographic research works best when you already know which brands to test. Franchise Local is a UK franchise directory that lets you filter opportunities by industry, investment level, lifestyle and location, so your shortlist reflects your budget and the way you want to work before you start analysing territories. Browse the Franchise Local directory, or read how to conduct franchise market research in the UK for the wider process. If you want a broader grounding first, the ultimate guide to franchising explains how buying a franchise works from start to finish. For market context, see UK franchising trends for 2026.
FAQ
What does demographic research mean for a franchise?
It means studying the age, income, household type and location of a franchise’s customers, then measuring how many of them are within reach of a territory. Buyers use it to test whether a territory can support the business. Franchisors use it to choose locations and set territory boundaries.
Where can I find free UK demographic data?
The Office for National Statistics publishes Census 2021 results for England and Wales, including age, household make-up, employment and housing. It also publishes business demography data and runs the Nomis service for local business and labour statistics. Scotland and Northern Ireland have their own census outputs.
How big should my franchise catchment area be?
It depends on the business. A shop or clinic draws from the area customers will travel to, while a mobile or home service is limited by drive time. Pick one measure, such as a 20-minute drive zone, and use it for every location you compare. Ask the franchisor how far customers travel at its best units.
Is demographic research enough to choose a territory?
No. It shows how many of the right people live nearby, not how much of the market competitors already hold. Check competition, transport and access, then test the results against the franchisor’s sales projections and your own costs before you commit.
Can franchisors use demographic research to find franchisees?
Yes. By profiling the franchisees who have performed best, a franchisor can look for areas where similar people live and focus recruitment there. Combining that with customer data helps match strong franchisee candidates to territories with real demand.